A few weeks ago, I attended my third LavaCon, “the conference on digital media and content strategies.” What a conference. As much as I wanted to gorge myself on every topic offered, I had to settle for taking in what I could—infosnacking, you might say. (Hat tip to Nick Kellet, who gave a talk entitled “The Infosnacker’s Guide to the Galaxy.”)
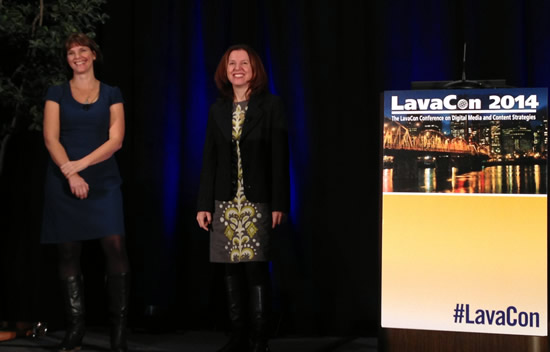
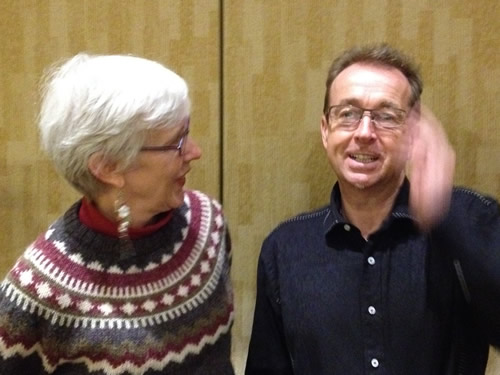
Kathy Wagner (left) and Melissa Breker, cofounders of Content Strategy, Inc., light up the LavaCon stage. The conference’s main hashtag—#LavaCon—lights up Twitter.
Since many of the LavaCon talks addressed social media and metrics, I’ve been playing with measuring the conference’s Twitter activity, a first for me. I used a free trial for a tool called Tweet Archivist. This exploration inspired me to share my findings with TechWhirl readers, especially those who attended LavaCon but also anyone who might appreciate discovering along with me the kinds of Twitter-usage metrics anyone has access to these days. (Tweet Archivist was the first tool I found. I’ve since discovered others—like Seen and Eventifier—that may have served the purpose even better. Oh well. Tweet Archivist gave me numbers to play with, so it accomplished my mission.)
For those of you who don’t use Twitter, I encourage you to try it especially when you attend conferences or other events associated with a Twitter hashtag. (A Twitter hashtag is a term preceded by a “#” symbol, like #LavaCon, creating a stream of related tweets that anyone can view, even people who have no Twitter profile. As LavaConner Darin McClure put it for a fellow attendee who didn’t use Twitter, “Hashtags create a conversational space.”) Until I tried Twitter at a conference myself a few years ago, I didn’t understand how much a hashtag’s “conversational space” enhances a large-group experience.
These days when I attend a conference, I stay tapped into the event’s tweet stream from a few days before to a few days after. Why? When you attend a popular event—this year’s LavaCon drew a record-breaking 300 people—you miss a lot. You can’t help it. In any given moment, you can talk with only a few nearby people and sit in on only one presentation.
Damn space and time! Always hemming us in.
That’s where a dedicated tweet stream comes in. If you go to Twitter.com and search on a hashtag of interest to you, say #LavaCon, you see a filtered stream of snack-sized messages that clue you in to what others in your tribe are thinking, doing, and seeing in that moment and in recent moments. You get to be in multiple places at once, with eyes and ears all over. People can join the conversation from anywhere in the world.
Take that, space and time!
For example, here’s a snippet from the #LavaCon stream the day after the conference ended.
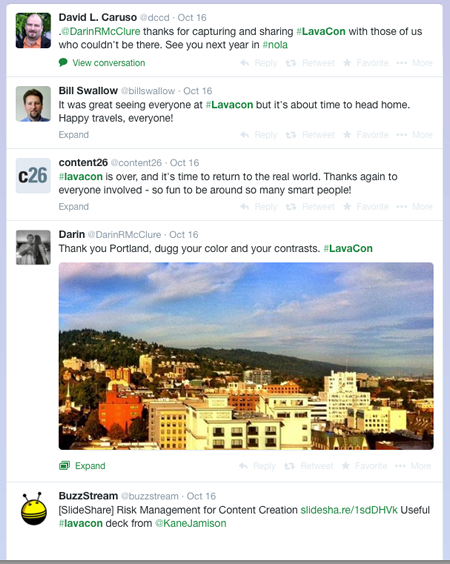
This sample from the #LavaCon stream hints at the kind of conversation people can have in under 140 characters. Green text is hotlinked; click it, and you bring up a person’s profile, another hashtag stream, or an expanded conversation.
As a conference attendee, even if you don’t contribute any tweets yourself, when you watch the tweet stream, you might discover fellow attendees you want to meet. You might find out where you left your glasses an hour ago. You might learn about a room change or a dinner outing you’d like to join. When you contribute tweets of your own—a quotation from a speaker, a photo, a video, something that made you laugh—you enrich the conversation.
It’s a bonding thing.
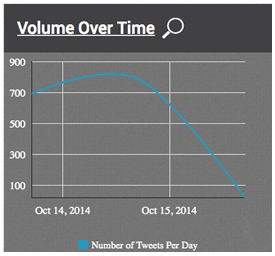
During the measured two-day span, #LavaCon, the more active of the two hashtags, appeared in 1,520 tweets. Unfortunately, this total—the fullest total I could get from Tweet Archivist—excludes October 13, Day One of the conference. Judging by the October 13 peak for the #LavaCon2014 hashtag, this #LavaCon “total” probably falls short by some 1,000 tweets.
You might wonder why I include this basic explanation for such a savvy audience, and maybe it is overkill. I include it because I’ve been surprised at the number of people I meet at conferences who don’t see why their fellow attendees bother with Twitter. I want them to at least understand what they’re missing.
During Lavacon, we may not have blown up Twitter exactly, but during some sessions I could have sworn that I felt the building shake. Let’s look at the conference’s Twitter metrics, starting with the number of tweets posted. The following two charts show the Tweet Archivist results for the hashtags in use at the conference: #LavaCon and #LavaCon2014.
As of 10:00 pm on October 15, the final conference day, these were the Tweet Archivist totals, including a term I hadn’t heard before: impressions.
#LavaCon: 1,520 tweets (incomplete data); 7,641,157 impressions
#LavaCon2014: 1,324 tweets; 3,613,878 impressions
Over 11 million impressions!
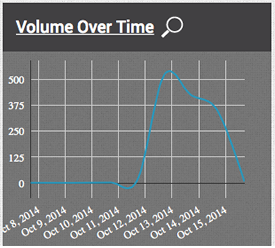
During the measured span of a full week, the #LavaCon2014 hashtag appeared in 1,324 tweets. Does the negative activity between October 11 and 12 catch your eye? The Tweet Archivist algorithm connects daily totals with artificially rounded lines. Either that or something mysterious happened when people en route to Portland were tweeting in airplane mode.
Sounds, well, impressive. It’s supposed to. In fact, the number of “impressions” is a nearly useless metric. Here’s the official Tweet Archivist definition:
Impressions are the total number of times that the tweets of an archive have been delivered to Twitter streams. Of course, not everyone who receives a tweet will read it … Impressions are the largest possible audience for the given archive … We think this … feature will be essential for users who want to know the effectiveness of a Twitter campaign and the reach of a given hashtag.
Hardly. The number of “impressions” tells us nothing about the reach of the #LavaCon hashtag. There’s no telling how many of those 11 million so-called “delivered” #LavaCon tweets went ta-da while people were off jogging or eating dinner. I don’t see how Tweet Archivist can determine how many tweets got “delivered” anyhow. Digital marketing pro Adam Helveh tells me that applications like this calculate “impressions” by multiplying each tweet by the tweeter’s number of followers. How misleading! Still, as unhelpful as this number—like many metrics—might be, the potential of those tweets boggles my mind, especially considering that most of the LavaCon tweeting was done by about twenty-five people.
To the negligible extent that “impressions” merit attention, let the record show that we probably exceeded 13 or 14 million “impressions”; the software underreported the #LavaCon hashtag by some 1,000 tweets. Tweet Archivist could capture only the last two days of activity for this hashtag. Tweet Archivist (maybe like all such web apps) is limited in the amount of historic data it can gather.
Listly.com cofounder Nick Kellet reenacts for me his LavaCon talk “The Infosnacker’s Guide to the Galaxy.” Or maybe he’s demonstrating his skill at speed tweeting. (Photo by Karen Ronning-Hall.)
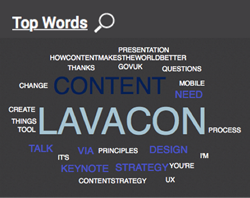
What else can we learn from the Twitter stats? Look at our two word clouds below, for example. What do they tell us about the people using our hashtags? We love? We live? We say thanks? We have principles? Like the number of “impressions,” these two word clouds have dubious value. I feel empowered, I suppose, knowing that I can pull this kind of infosnack out of the great data fridge in the sky if I want to, even if the snack leaves me hungry.
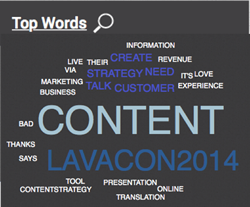
And, what the heck, these word clouds have their amusement value. For example, in the #Lavacon2014 stream, the word cloud reveals that one of the most frequently used words was HowContentMakesTheWorldBetter. Makes me smile.
Some of the top words used in the #LavaCon2014 stream have their own charm.
The top words used in the #LavaCon stream don’t tell us a lot, but reading them sequentially lends them a certain primitive charm.
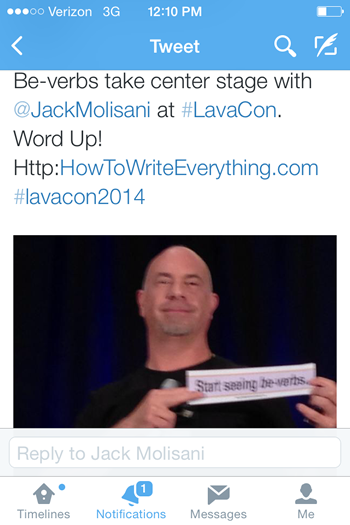
LavaCon organizer Jack Molisani joins the tweet stream as he raffles off my “Start seeing be-verbs” bumper sticker during his conference wrap-up. If you think he looks fuzzy, you should have seen the rest of us by the end of Day Three.
The Tweet Archivist report also includes the following data for our hashtags:
- top tweeters (twenty-five or so generated most of the tweets)
- sources (#1: Twitter for iPhone)
- top URLs cited
- languages
- top influencers
- top hashtags (including #Veaknesses, #Georging, and #HowContentMakesTheWorldBetter—that oh-so-accessible camel case is for you, Char James-Tanney.)
Interested in those details? Download this PDF: Marcia’s infosnacker’s guide to the 2014 LavaCon tweet stream—full report
What this write-up needs now is a call to action. In the spirit of conversation, let me ask you. Based on what you know about Twitter hashtags and metrics, what action would you ask people to take now? Tweet your ideas to #LavaCon @MarciaRJohnston. See you around the stream.